![]() If you are like most project managers, you wish you had a better real-time handle on the progress of your project so you could predict when you will finish or when a change is needed in order to stay on track. I have used a simple yet powerful method that is applicable to most projects and can tell you months in advance if you are off track or if scope creep is threatening to destroy your schedule. The method is straightforward and only requires a detailed task list and that the tasks are checked off as the project progresses. If you spend the time with the project team to develop a detailed work breakdown schedule (WBS), you have all the data you need for this method. WBS data should be available for even the simplest projects and is often in spreadsheet form as a simple list of tasks, making the method described here very easy to implement. The method is far easier to use to monitor progress and identify when things are going awry than either PERT or Gantt charts. Here is the method:
If you are like most project managers, you wish you had a better real-time handle on the progress of your project so you could predict when you will finish or when a change is needed in order to stay on track. I have used a simple yet powerful method that is applicable to most projects and can tell you months in advance if you are off track or if scope creep is threatening to destroy your schedule. The method is straightforward and only requires a detailed task list and that the tasks are checked off as the project progresses. If you spend the time with the project team to develop a detailed work breakdown schedule (WBS), you have all the data you need for this method. WBS data should be available for even the simplest projects and is often in spreadsheet form as a simple list of tasks, making the method described here very easy to implement. The method is far easier to use to monitor progress and identify when things are going awry than either PERT or Gantt charts. Here is the method:
![]()
- Break your project down into steps of about 1% of the overall expected project duration. For example, if the project is expected to take six months, then the individual tasks should be between 8 and 48 hours in duration. The goal is to have at least 100 tasks, but ideally many more. The exact number does not matter, nor does the type of activity, but the more tasks, the better the estimate as task estimate errors will average out.
- Draw an x/y graph with the y-axis indicating tasks remaining and the x-axis representing time, as shown here:

Draw a straight line from the total tasks on the y-axis (100 in this case) down to the total expected project duration on the x-axis as shown here:
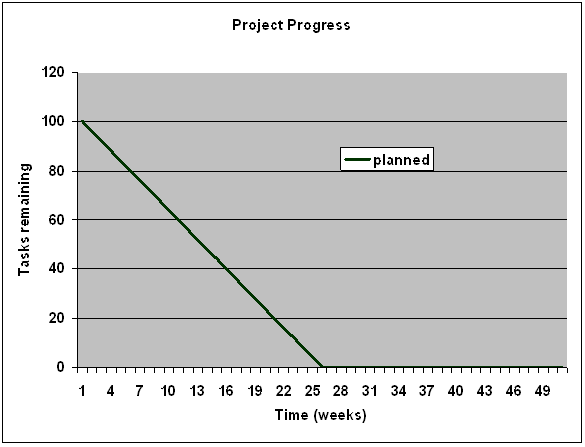
This line represents the ideal execution path of the project.
As tasks are completed, plot the number of remaining tasks at regular intervals, say every day or week, as shown here:
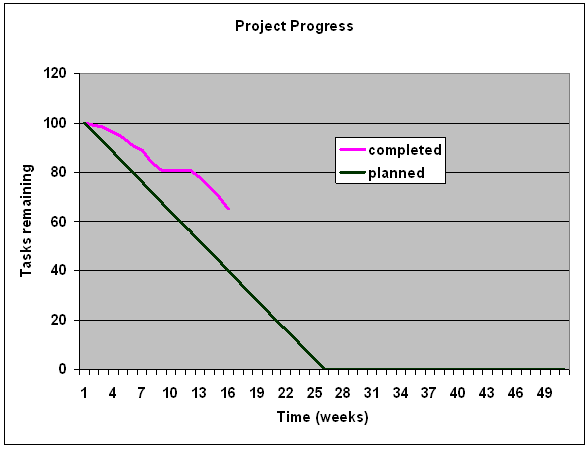
As the project progresses, if the task remaining line is above the planned line, the project is behind schedule. If it is below, the project is ahead of schedule (Note: it is rare that any portion of the tasks remaining line is below the planned line).
Add tasks to the task list as they are added to the project, whether they were forgotten when the WBS was created, or due to scope creep. This will result in a bump up in the completed task list.
The result should look something like this: 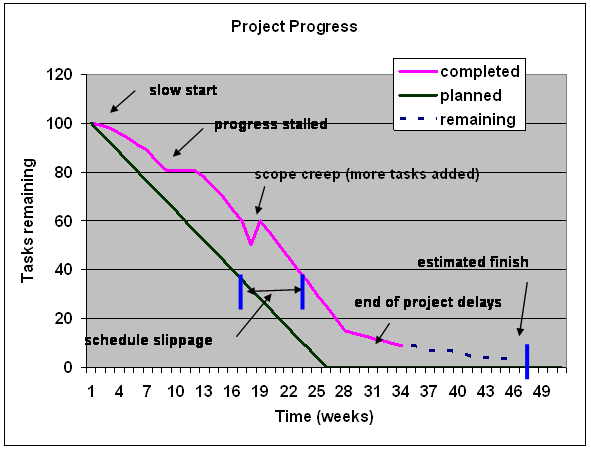 As you can see from this simple tracking mechanism, the most common project problems are easy to spot. They are:
- Slow startup
- Progress stalled (stuck team)
- Scope creep
- Schedule slippage (over the planned line)
- Estimated finish date slips
And, there are two more terrific things about the chart that is built as the project progresses:
- Makes a great communication tool for management review meetings as you can document the effects of project problems and scope creep, making your arguments months earlier look like you really knew what you were talking about.
- The chart fits on a single PowerPoint slide!
Try this method on your next project. You won’t be disappointed.
Loyal has more than 25 years of engineering and management experience in high-tech R&D, manufacturing, and information technology. He has worked as a design engineer, project manager, section manager and manufacturing engineering manager and has led teams that included virtual and telecommuting contributors from all over the world. He is an expert in the use of collaborative technologies for virtual teams and has led advanced technology research teams chartered with improving the effectiveness of virtual workers. You can write him at [email protected]. He is currently building a virtual work support site at http://commutezero.com/. Feel free to visit and contribute to the effort.


Very cool Loyal, this looks a lot like the progress reporting I used when I was on a team doing SCRUM…it was called a burn-down chart in that environment, with features counted down on the vertical axis.
To collect status on tasks, I found the war room is a great way to do it. I wrote about it here in an article about applying SCRUM concepts and tools to traditional project management.
Josh Nankivel
pmStudent.com
The Art of Project Management